Visualize Results
Author Network
The author network detects groups of authors and connections between those groups within a set of results.
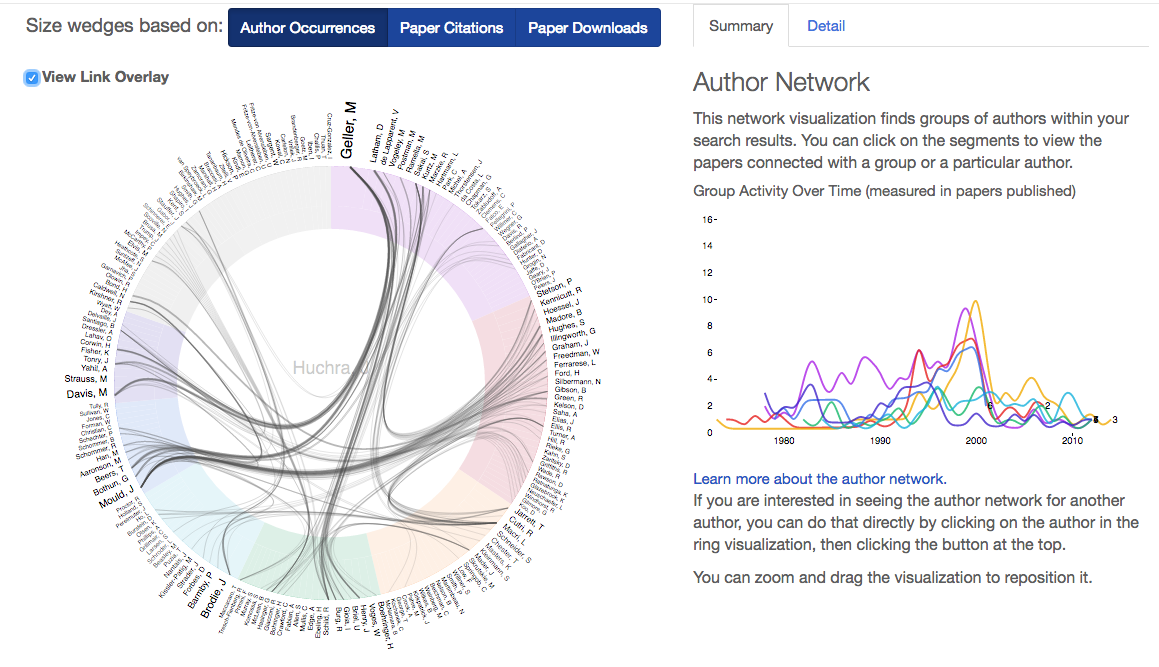 An image of the author network for John Huchra with the link overlay activated.
How the network is made
The author network takes the top 200 most frequently appearing authors within your result set, measures the frequency of collaboration between them, and displays color-coded groups of authors organized around a center point.
How to use it
Clicking on an inside edge of a group will show you all papers from that group. Clicking on an outside edge, or an author name, will show you all papers by that particular author.
-
Quickly drill down to relevant results To quickly narrow down your search results to papers from a certain collaboration group, select the group, click the “add to filter” button, and filter your ADS search.
-
Visually explore your results set To get an at-a-glance overview of a scientist’s career, search “author:LastName,FirstName” in ADS, view the network, and quickly see an organized overview of important collaborators.
-
Answer specific questions about the results set
- To find authors who collaborate not only within their group but outside of it, check the “view link overlay” box and see which authors tend to collaborate with authors in other groups.
- To see the collaborations that have been most fruitful in terms of citations yielded, under “Size wedges based on”, click “Paper Citations”.
Paper Network
The paper network detects groups of papers based on shared references between those papers. In general, papers with many shared references will tend to have similar topics.
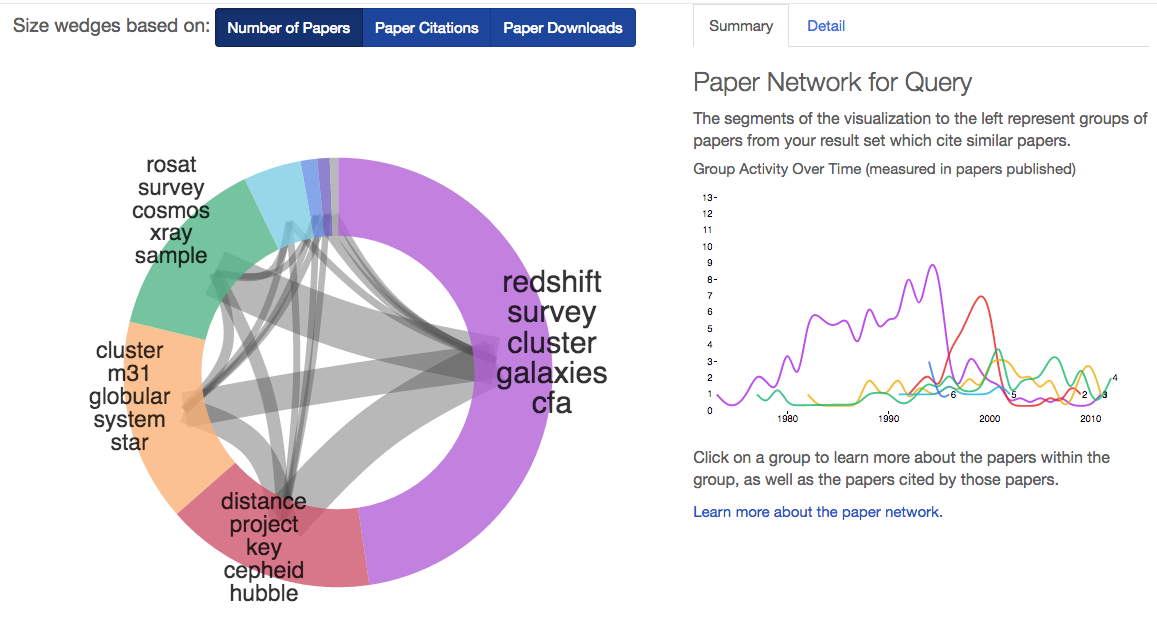 Paper network for John Huchra.
How the network is made
The paper network creates groups of papers that share a significant number of references, and names those groups by looking for shared, unique words in their titles.
How to use it
-
View your results grouped by sub-topic Because papers with similar references tend to be on similar subjects, you can see a rough guide to the main topics within your search results.
-
Find the most significant papers on different topics Click a group to see information about the most cited papers from that group in the right info pane.
-
Find relevant papers NOT in your result set Clicking on a group will also show you in the right pane the most commonly referenced papers from a group. Often these papers do not appear in your actual result set, and yet given their influence they might be highly relevant to your area of interest.
Results Graph
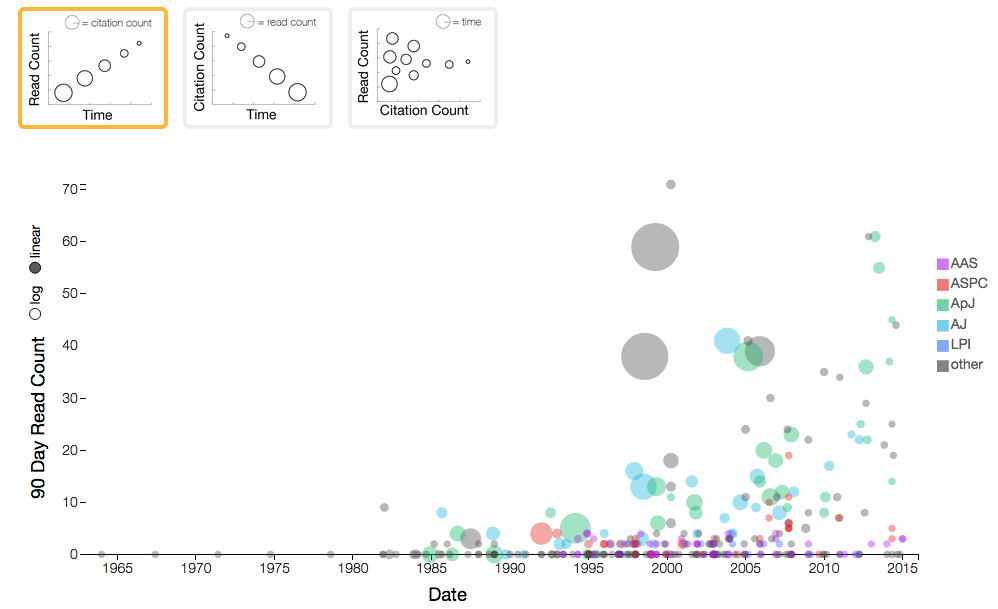
When you look at a list of ADS search results, you can sort by date published, by citation count, or by recent popularity of the article in ADS, but you cannot see all of these dimensions at once, and you cannot easily see outliers. The results graph is a customizable scatter chart that allows you to assign values to the x and y axes as well as to the radius of the circle representing a paper.
How to use it
-
Filter your search results Mouse over a circle to read information about the paper, or drag a square around a number of circles and click on the green “submit filter” button below the graph to limit your search results to the selected papers.
-
Find newly popular papers The default graph shows the recent views (the number of times a paper has been accessed in ADS in the last 90 days) as the y-axis value. In general, graphs will show a trend of decreasing reads over time as an article ages. If any paper has a higher read count than predicted by the general trend, it might be worth investigating further.
Concept Cloud
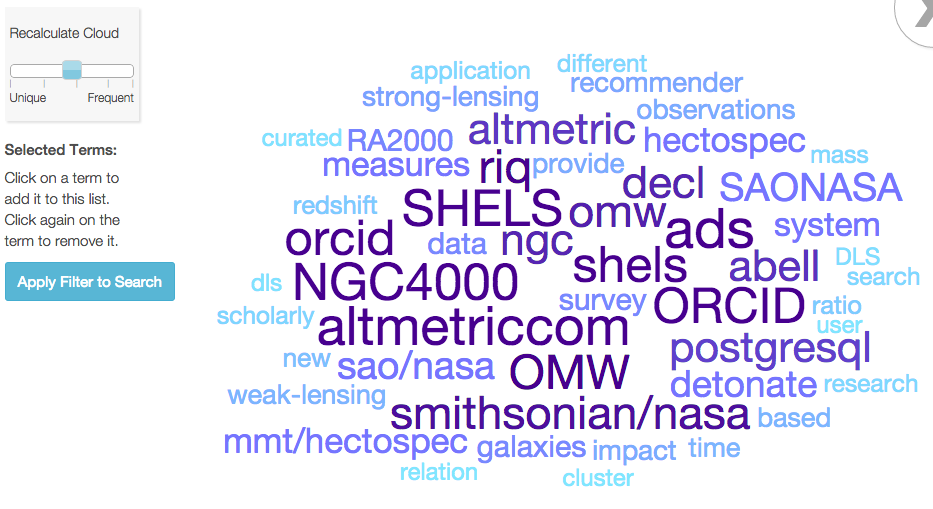
The concept cloud shows you frequently appearing and unique words in your search results.
How the concept cloud is made
The concept cloud takes words from the titles and abstracts of your search results, counts their frequencies and compares them to the same word’s frequency across the entire ADS corpus.
How to use it
- Move the slider to the left of the concept cloud towards “unique” to see those words that appeared relatively frequently in your results but rarely in the rest of ADS.
- Move the slider to the left of the concept cloud towards “frequent” to see those words that appear frequently in your results, regardless of how often they appear in the rest of ADS.
Instructions on Downloading Graphics as High-Quality PNGS in Chrome
- Install the SVG Crowbar 2 Bookmarklet
- Open the graph in ADS (currently the paper and author networks have the best support)
- Click the SVG Crowbar icon, you will see something that looks a bit messy, like this:
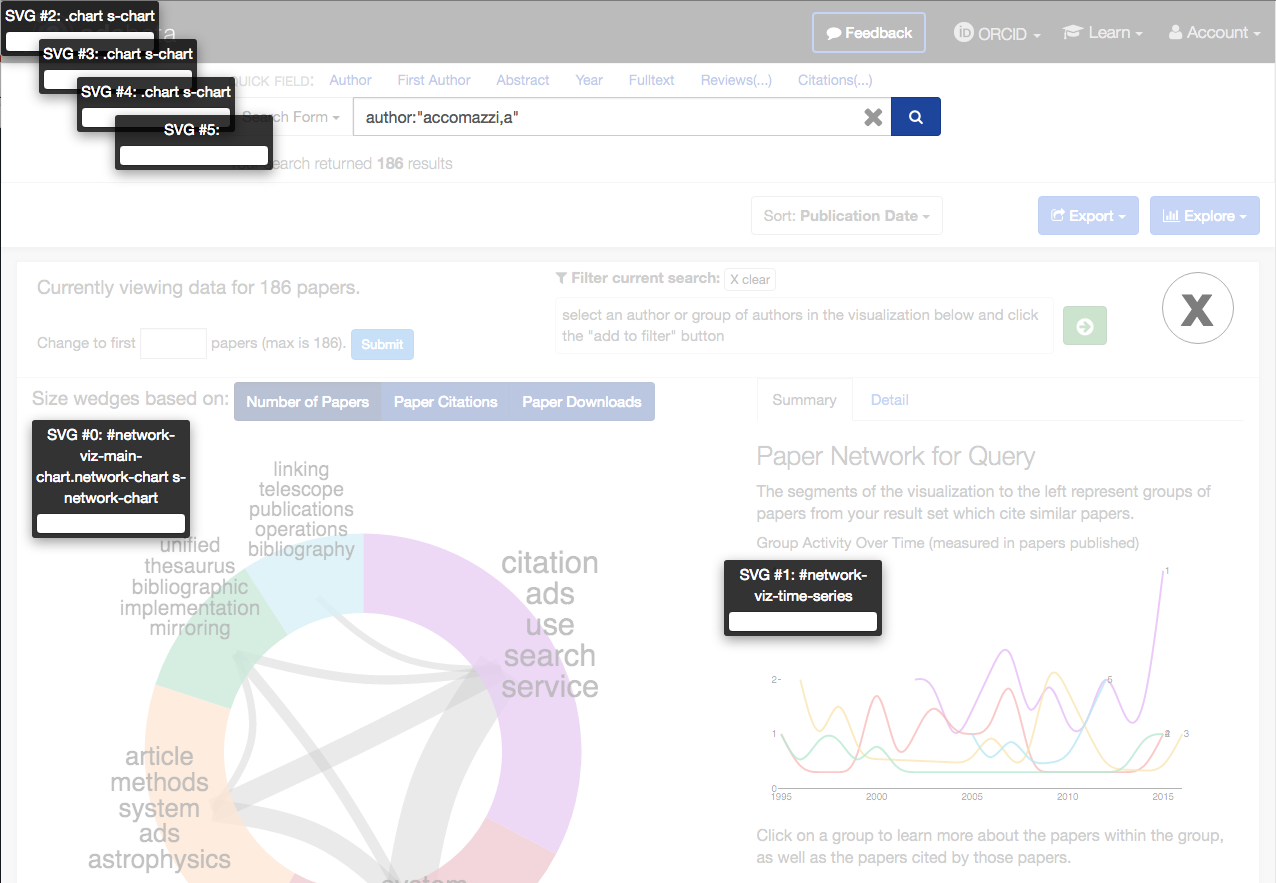
- Click on the two bottom buttons: #network-viz-main-chart to download the main chart, and #network-viz-time-series to download the accompanying time series graph.